PX154 - C4 - pV diagrams 2
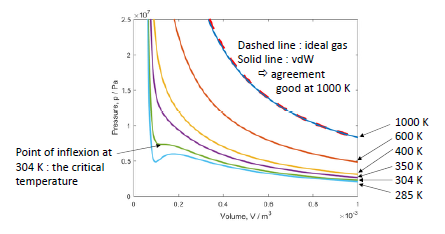
- at high temperature, very similar results from ideal gas and vdW equations
- vdw predictions differ at low temperatures
- at
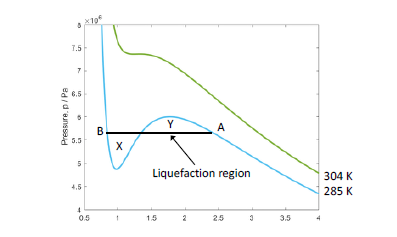
, curve shows a point of inflexion - at lower temperatures, curve shows a local maximum and minimum
- this is not physical: gas pressure doesn't change in this manner
- to interpret this, a horizontal line is drawn such that
- compressing from high volumes, it begins to liquify at
- further compression increases liquification
- all gas is liquified at
- pressure remains constant throughout
- note that curve is much steeper at lower volumes as liquid is difficult to compress
- compressing from high volumes, it begins to liquify at
- at